Annual cycle of storm surges
The seasonal amplitude (i.e. the amplitude of the annual cycle) and the timing of the storm surge season (i.e. the phase of the annual cycle) were estimated at each of the 10 selected stations, by fitting a GEV with time-dependent parameters (method 1) on the data set. The seasonal amplitude varies from 10 to 40 cm (Fig. 2a), with the lowest values in the South (Spain). This annual adjustment of the surcharges is significant. It accounts for about 30% of the storm surge signal, which varies in intensity from 30 cm in the South to 80 cm in the North (Supplementary Fig. S2). Regarding the phase of the annual cycle (Fig. 2b), the storm surge season is later in the South than in the North (around mid-January in Spain, but rather late December in the North Sea).
Characterization of the annual storm surge cycle: (a) seasonal amplitude and (b) time of storm surge season. These two parameters are calculated from the model based on GEV (Method 1).
Large-scale shift in storm surge season
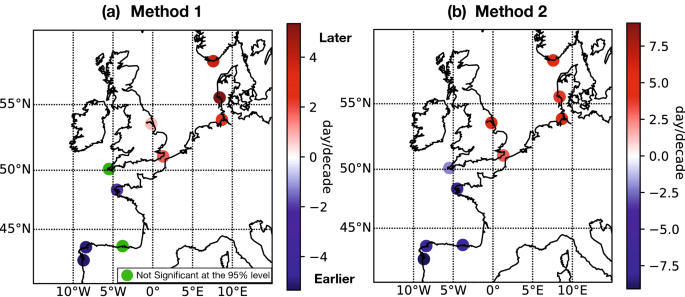
The timing of the storm surge season was estimated annually, at each of the 10 selected stations, using 2 different methods: a GEV with time-dependent parameters fitted over a 20-year sliding window (method 1) , and a non-parametric statistical method. (method 2, green curve in Fig. 5). Linear trends between 1950 and 2000 were then calculated. These trends represent the shift in timing of the storm surge season, between 1950 and 2000, and are shown in Fig. 3 and displayed in Table 1.

Lag in timing of storm surge season between 1950 and 2000, where storm surge timing is calculated with (a) the GEV analysis called method 1 (b) the nonparametric method called method 2. The lag is the linear trend between 1950 and 2000. Note that the color bars have a different range.
The results show a large-scale shift between 1950 and 2000, positive in northern Europe (north of 51 N), negative in southern Europe. Importantly, both methods give similar results (Fig. 3a–b). The storm surge season occurs about 4 days/decade later north of 51 N, and about 5 days/decade earlier south of 51 N. At Brest, we found a negative shift of -2 days/decade (with the first method), which is consistent with the change reported by Reinert et al.21although data from Brest are treated slightly differently here (we used GESLA-2 data, whereas Reinert et al.21 used tide gauge data from the French Hydrographic and Oceanographic Service; the raw data (water levels) are the same, but the storm surges differ slightly, due to different processing1.21). It should be noted that the shift values are generally greater with the second method than with the first: north of 51 N, the shift varies from 3 to 5 days/decade with method 2, but only between 2 and 5 days with method 1 (see table 1). Similarly, south of 51 N, the shift is about -6 days/decade with method 2, but only -4 days with method 1. Also note that the shift is not significant at two stations (Newlyn and Santander) with method 1, the case of Newlyn not being surprising, since it is located very close to 51 N (ie an offset close to zero). Importantly, using a different method based on monthly analysis, Reinert et al.21 found similar indications on the seasonal shift for stations located around Brest.
In the following, we only consider the timing of the storm surge season calculated with method 2, since the results are similar with methods 1 and 2 (Fig. 3).
Possible causes
In this section, we show that the timing of the storm surge season is strongly correlated with the winter NAO index. Such a correlation suggests a key role for the large-scale atmospheric circulation of the North Atlantic. Moreover, we show that the seasonal shift is already present in the atmospheric data, which has been little discussed so far, to our knowledge.
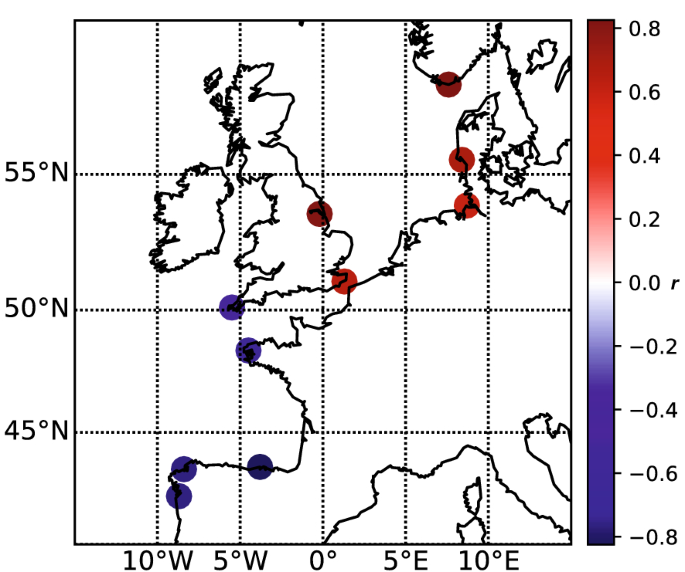
At each of the 10 selected stations, we calculated the correlations (r value) between the time of the storm surge season (estimated with method 2, see the green curve in Fig. 5a) and the winter NAO index. We did this over the longest period of storm surge data available at each station. The results show a strong positive correlation north of 51 N and a strong negative correlation south of 51 N (Fig. 4). On average, the correlation in the North is around 0.75, with a maximum of 0.87 in Tregde. In the South, the average correlation is -0.71 with a minimum of -0.86 in Santander. These strong correlations suggest a key role of atmospheric circulation on the timing of the storm surge season. This is not surprising since storm surges are primarily generated by wind stress and atmospheric pressure. Note that the correlations are similar whether the timing of the storm surge season is calculated with Method 1 (Supplementary Fig. S4) or Method 2 (Fig. 4).

Correlation coefficients, rbetween the winter NAO and the time of the storm surge season calculated with method 2 (non-parametric statistics).
We then calculated the timing of atmospheric storm events, to determine if the time lag is already present in the atmospheric data between 1950 and 2000. To do this, we analyzed the wind and SLP time series from the 20CR gridded data , exactly the same way we analyzed storm surges from GESLA-2 data with method 2 (i.e. the timing of the storm season is calculated as the average date of the 5 winter events strongest, smoothed with a 20-year moving average). At each station, the atmospheric time series (wind or SLP) were not taken at the grid point closest to the station, but at the grid point where the correlation is maximum between the atmospheric data and the storm surges at station (Fig. S3). This takes into account that storm surges are not always driven by very local atmospheric conditions, but by distant atmospheric conditions, generating storm surges that propagate to the coast. In practice, for each station, these correlations are calculated between the storm surges at the station and the zonal wind (as well as the SLP) at each point of a 1° × 1° grid, extending from 35 N to 70 N, and 20 W at 20 E, over the period 1980-2000 (Supplementary Fig. S3). Atmospheric time series are taken from 20CR at the point of maximum correlation, shown in Fig. S3 (additional) by a green star for the zonal wind and a green triangle for the SLP. These atmospheric time series are then analyzed in exactly the same way as storm surges, to estimate the timing of extreme atmospheric events. Note that we only considered the zonal wind, as we found very weak correlations between surges and southerly winds (not surprisingly, storm surges are mainly due to westerly winds).
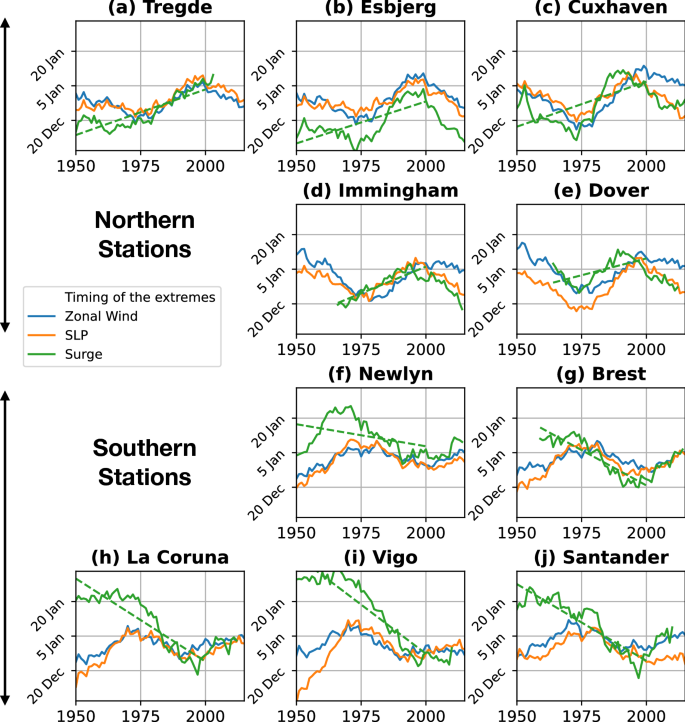
The results show that the timing of storm surge events (green curve in Fig. 5) is close to the timing of atmospheric storm events (blue/orange curve for zonal wind/SLP events in Fig. 5 ), in particular for the seven stations north of 45 N (located in the English Channel and the North Sea, Fig. 5a–g). For these seven stations, the curves follow each other well, with differences in the timing of the storm surge and atmospheric events of less than 5 days. Only Newlyn shows larger differences, reaching 10 days before the 1980s. Nevertheless, for all of these seven northern stations, the correlation between the timing of storm surge events and extreme SLP events is quite high, with significant values greater than 0.5 everywhere (Supplementary Fig. S5b, north of 45 N). Similarly, the correlation between storm surge events and extreme wind events is also high (Supplementary Fig. S5a, north of 45 N), except at Immingham and Dover. Both of these exceptions are easily explained: along the east coast of the UK, storm surges are generated by northerly winds behind the center of the storm over Scandinavia.33. For this reason, there is no significant correlation between storm surge and zonal wind (Supplementary Fig. S5a). For the other three stations located south of 45 N (along the Spanish coasts), the chronology of storm surge events matches quite well the chronology of atmospheric events over the past decades, but not before the 1980s, with large differences exceeding 15 days (Fig. 5h–j). Correlations at these three stations are weak or insignificant (Supplementary Fig. S5, south of 45 N). These discrepancies will be explained later, as southern stations can be affected by storms of different weather patterns (see discussion).

Calendar of the season of extreme zonal winds (blue), extreme low pressure (orange) and storm surges (green) for each station from 1950 to 2015. The calendar is calculated with the non-parametric method (method 2) . Note that the meteorological data are not extracted at the closest point to the station, but at the point where the correlation with the storm surge is maximum (see text).
The good agreement between the timing of the extreme surge season and the storm season suggests that the observed seasonal shift between 1950 and 2000 stems from a change in atmospheric data. At northern stations, this was confirmed by calculating the linear trend of SLP and wind events between 1950 and 2000 (Table 2), in exactly the same way as for the storm surge season (Fig. 3b) . We found a positive shift of about 2 days/decade north of 51 N. Note that at southern stations the time shift of meteorological data is mostly positive (Table 2), which is not consistent with the negative offset of storm surge data. (Table 1). These discrepancies are due to the poor concordance, at southern stations, between the timing of the storm surge season and that of atmospheric events (mentioned just above). Note that these discrepancies in the South will be explained later (see the “Discussion”).


