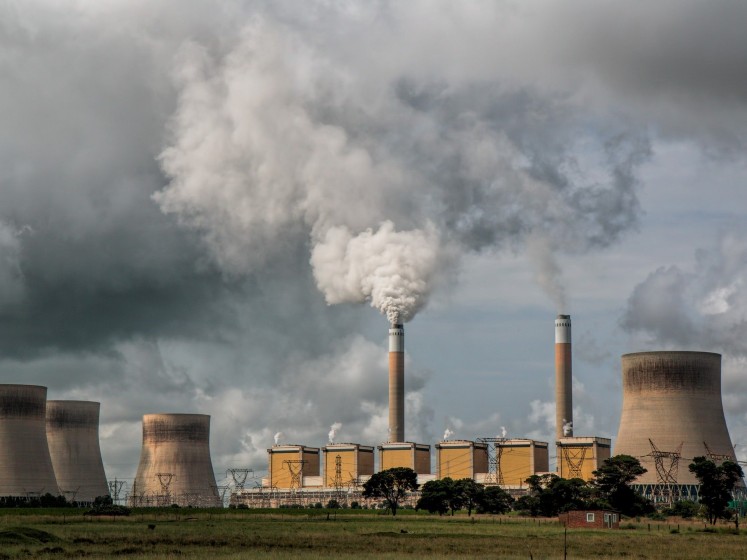

Computer models of the climate are at the heart of calls to ban the cheap, reliable energy that powers our thriving economy and promotes healthier, longer lives. For decades, these models have projected dramatic warming small fossil increases in atmospheric carbon dioxide concentrations, with catastrophic consequences.
Yet real-world data doesn’t cooperate. They only show a slight warming, especially at night and in winter. According to the United Nations Intergovernmental Panel on Climate Change, there has been no systematic increase in the frequency of extreme weather events, and the continued sea level rise that began with the end of the ice age continues without much increase in magnitude. The constancy of terrestrial records is evident in Data of the National Oceanic and Atmospheric Administration.
Should we trust these computer models of doom? Let’s find out by comparing actual temperatures since 1979 with what the 32 families of climate models used in the latest UN climate science report predicted.
Atmospheric scientist John Christy has developed a record of the global lower atmosphere temperature using highly accurate satellite soundings. NASA honored him for this achievement and he was the author of a previous edition of the UN report. He told a House Science Committee hearing in March 2017 that the UN’s climate models had failed badly.
Christy compared with average model projections since 1979 to the most reliable observations – those made by satellites and weather balloons over the vast tropics. The result? In the upper levels of the lower atmosphere, the models predicted Seven times as much warming as observed. Overestimation also occurred at all other levels. Christy recently concluded that on average, the heating projected by the models is three times greater than what has been observed.
This is a critical error. Getting the right tropical climate is essential to understanding the global climate. Most atmospheric moisture comes from the tropical ocean, and the difference between the surface temperature and the upper atmospheric temperature determines the amount of moisture that rises in the atmosphere. It is important. Most terrestrial agriculture depends on the transfer of moisture from the tropics to temperate regions.
Christy doesn’t watch surface temperatures, as measured by weather station thermometers. Instead, it looks at temperatures measured from calibrated thermistors carried by weather balloons and data from satellites. Why didn’t he just look here, where we all live? Because surface temperature records have been severely compromised.
Globally averaged thermometers show two periods of warming since 1900: half a degree due to natural causes in the first half of the 20th century, before there was an increase in industrial carbon dioxide sufficient to produce it, and another half degree in the last quarter of the century.
The last United Nations Scientific Compendium asserts that this last half degree is at least half man-made. But thermometer records showed the warming stopped from 2000 to 2014. Until they stopped. In two of the four global surface series, the data was adjusted in two ways that erased the “pause” that had been observed.
the first adjustment changed the way ocean surface temperature is calculated, replacing satellite data with drifting buoys and temperatures in ships’ water intakes. The size of the vessel determines the depth of the intake tube, and steel vessels heat up tremendously in sunny, hot conditions. Buoy temperatures, which are measured by precise electronic thermistors, have been adjusted upwards to match questionable data from the vessel. Since the network of buoys has become more extensive during the break, this guarantees an artificial heating of the data.
The second big adjustment was over the Arctic Ocean, where there are no weather stations. In this revision, temperatures were estimated from nearby ground stations. It goes against basic physics.
Even in hot summers, there is a lot of ice over much of the Arctic Ocean. Now, for example, when sea ice approaches its annual minimum, it still extends over part of the east coast of Greenland. As long as the ice-water mixture is stirred well (like a glass of ice water), the surface temperature remains at freezing point until all the ice melts. Thus, the extension of terrestrial records over the Arctic Ocean adds non-existent warming to the record.
In addition, global and US data has been frequently adjusted. There is nothing scientifically wrong with adjusting data to correct for changes in the way temperatures are observed and changes in thermometers. But each serial adjustment tended to cool the early years, which accentuates the warming trend. It’s wildly unlikely.
In addition, thermometers are housed in standardized instrument shelters, which must be kept in a specified shade of white. Shelters in poorer countries are not repainted as often and darker stations absorb more solar energy. It’s no surprise that poor tropical countries show the greatest warming due to this effect.
All this to say that the weather balloon and satellite temperatures used in Christy’s testimony are the best data we have, and they show that the UN climate models just aren’t ready for prime time. .
Patrick Michaels was a research professor of environmental science at the University of Virginia for 30 years and is the author of the next book Scientocracy. Caleb Stewart Rossiter taught climate statistics and mathematical modeling at American University. They are currently with the CO2 Coalition in Arlington, Virginia.
/cloudfront-us-east-1.images.arcpublishing.com/gray/HAQHVR4PTFEPFIE77LUEQ2PR7I.jpg)